23. Making Histograms
Making Histograms
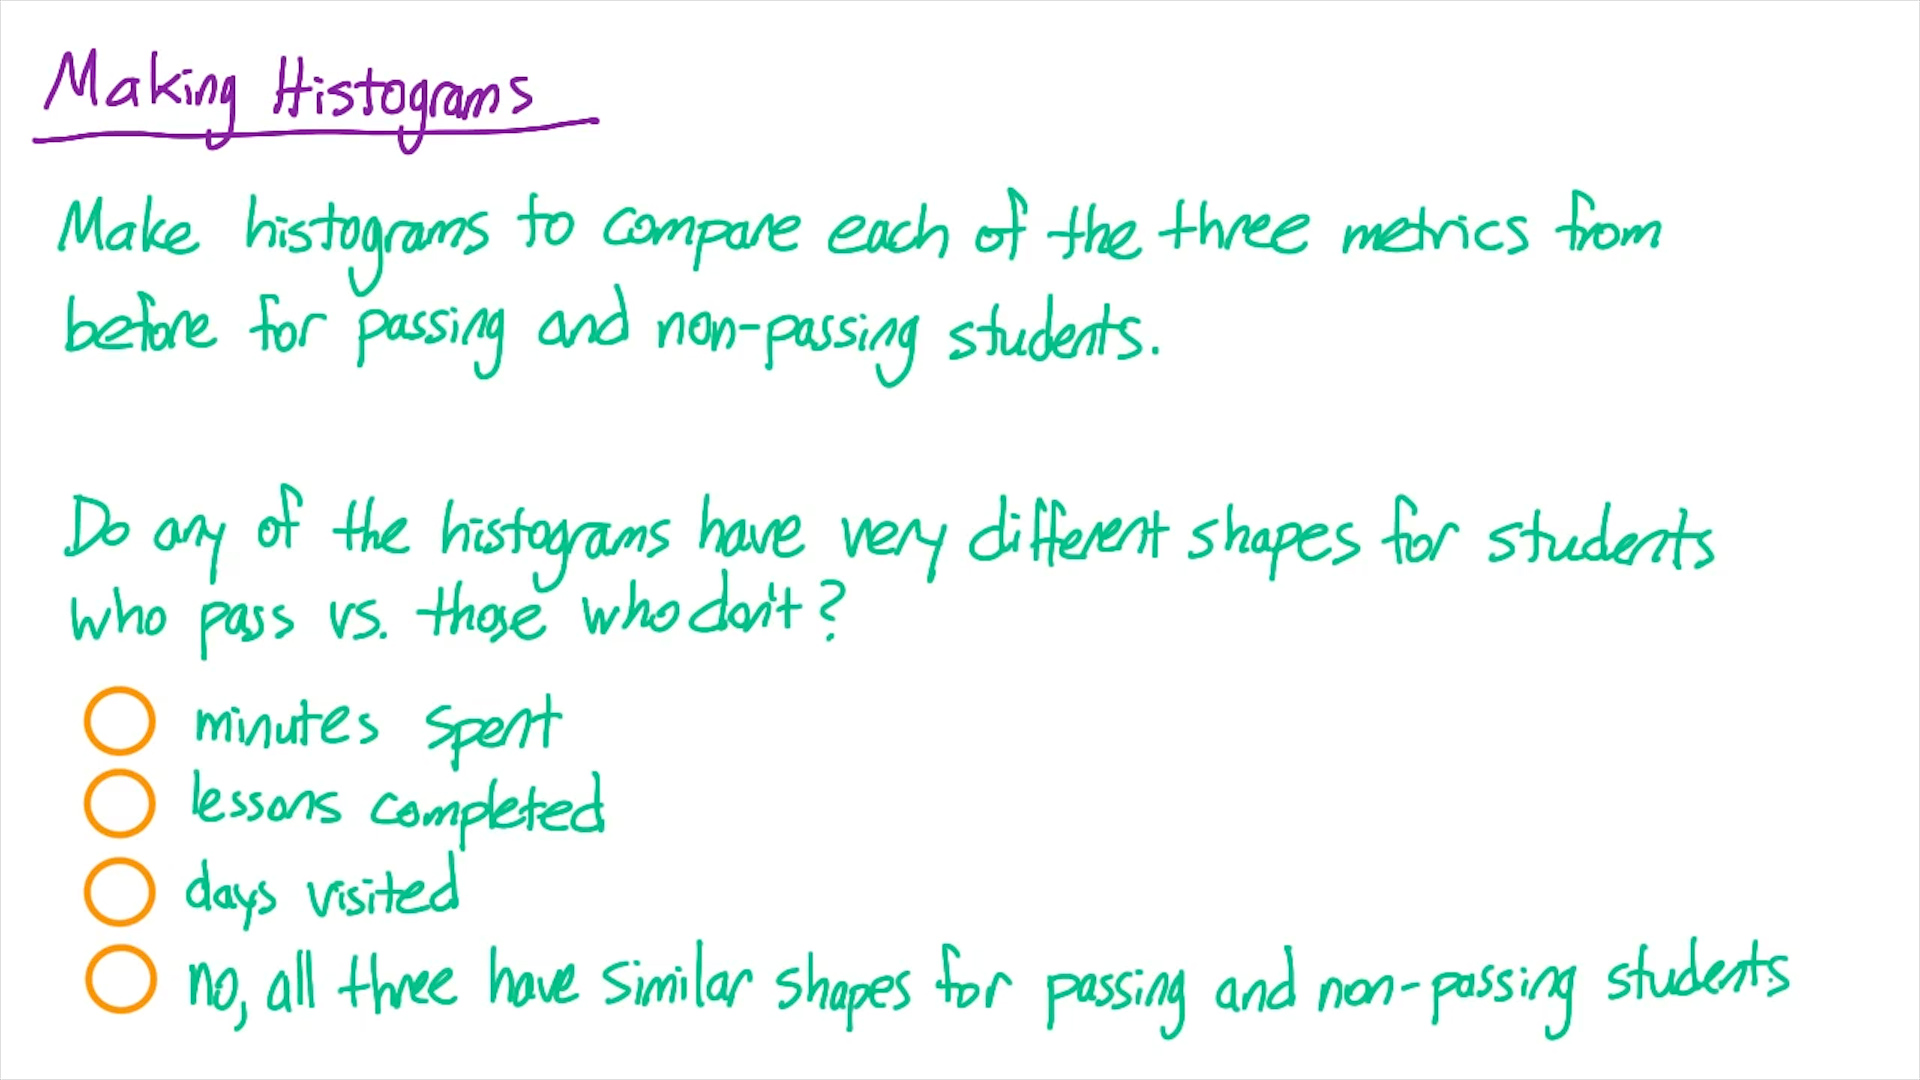
Question:
Visualizing data
Even though you know the mean, standard deviation, maximum, and minimum of various metrics, there are a lot of other facts about each metric that would be nice to know. Are more values close to the minimum or the maximum? What is the median? And so on.
Instead of printing out more statistics, at this point it makes sense to visualize the data using a histogram.
Making histograms in Python
To make a histogram in Python, you can use the matplotlib library, which comes with Anaconda. The following code will make a histogram of an example list of data points called data.
data = [1, 2, 1, 3, 3, 1, 4, 2]

%matplotlib inline
import matplotlib.pyplot as plt
plt.hist(data)
The line %matplotlib inline is specifically for IPython notebook, and causes your plots to appear in your notebook rather than a new window. If you are not using IPython notebook, you should not include this line, and instead you should add the line plt.show() at the bottom to show the plot in a new window.
Making histograms of student data
Now use this method to make a histogram of each of the three metrics we looked at for both students who pass the subway project and students who don't. That is, you should create 6 histograms. Do any of the metrics have histograms with very different shapes for students who pass the subway project vs. those who don't?
You can also create histograms of the metrics you explored on your own if you'd like.
Start Quiz:
Solution:
INSTRUCTOR NOTE:
Solutions
If you want to check our solution for the problem, look at the end of this lesson for Quiz Solutions.